
From Cycles To Continuity: Why Bitcoin’s 4-Year Pattern May Be Breaking

By:Newsbtc
Bitcoin has lost more than 30% of its value since early October, triggering a sharp shift in market psychology. What was once viewed as a routine correction is increasingly being interpreted by analysts as a potential cycle top. Sentiment has deteriorated quickly, with fear and apathy replacing the optimism that dominated earlier in the year.
Many investors are now positioning defensively, preparing for what they believe could be a prolonged bear market phase similar to past post-peak cycles.
However, a recent CryptoQuant report challenges this increasingly popular narrative. According to the analysis, Bitcoin may no longer be following the traditional four-year boom-and-bust cycle that has defined its historical price behavior.
var rnd = window.rnd || Math.floor(Math.random()*10e6); var pid607465 = window.pid607465 || rnd; var plc607465 = window.plc607465 || 0; var abkw = window.abkw || ''; var absrc = 'https://servedbyadbutler.com/adserve/;ID=172179;size=0x0;setID=607465;type=js;sw='+screen.width+';sh='+screen.height+';spr='+window.devicePixelRatio+';kw='+abkw+';pid='+pid607465+';place='+(plc607465++)+';rnd='+rnd+';click=CLICK_MACRO_PLACEHOLDER'; document.write('
');
if (!window.AdButler){(function(){var s = document.createElement("script"); s.async = true; s.type = "text/javascript";s.src = "https://servedbyadbutler.com/app.js";var n = document.getElementsByTagName("script")[0]; n.parentNode.insertBefore(s, n);}());}
var AdButler = AdButler || {}; AdButler.ads = AdButler.ads || []; var abkw = window.abkw || ""; var plc366606 = window.plc366606 || 0; (function(){ var divs = document.querySelectorAll(".plc366606:not([id])"); var div = divs[divs.length-1]; div.id = "placement_366606_"+plc366606; AdButler.ads.push({handler: function(opt){ AdButler.register(172179, 366606, [728,90], "placement_366606_"+opt.place, opt); }, opt: { place: plc366606++, keywords: abkw, domain: "servedbyadbutler.com", click:"CLICK_MACRO_PLACEHOLDER" }}); })();
Instead, the report introduces the Bitcoin Supercycle thesis, which argues that the classic halving-driven cycle structure could be breaking down in favor of a more extended, structurally supported bull market.
The core idea behind the supercycle framework is that Bitcoin’s market dynamics have fundamentally changed. Unlike previous cycles driven largely by speculative retail flows, the current environment is shaped by new forces that did not exist in earlier eras.
These structural shifts may be altering how drawdowns, tops, and recoveries unfold, potentially smoothing volatility over longer time horizons.
var rnd = window.rnd || Math.floor(Math.random()*10e6); var pid607472 = window.pid607472 || rnd; var plc607472 = window.plc607472 || 0; var abkw = window.abkw || ''; var absrc = 'https://servedbyadbutler.com/adserve/;ID=172179;size=0x0;setID=607472;type=js;sw='+screen.width+';sh='+screen.height+';spr='+window.devicePixelRatio+';kw='+abkw+';pid='+pid607472+';place='+(plc607472++)+';rnd='+rnd+';click=CLICK_MACRO_PLACEHOLDER'; document.write('
');
if (!window.AdButler){(function(){var s = document.createElement("script"); s.async = true; s.type = "text/javascript";s.src = "https://servedbyadbutler.com/app.js";var n = document.getElementsByTagName("script")[0]; n.parentNode.insertBefore(s, n);}());}
var AdButler = AdButler || {}; AdButler.ads = AdButler.ads || []; var abkw = window.abkw || ""; var plc452518 = window.plc452518 || 0; (function(){ var divs = document.querySelectorAll(".plc452518:not([id])"); var div = divs[divs.length-1]; div.id = "placement_452518_"+plc452518; AdButler.ads.push({handler: function(opt){ AdButler.register(172179, 452518, [728,90], "placement_452518_"+opt.place, opt); }, opt: { place: plc452518++, keywords: abkw, domain: "servedbyadbutler.com", click:"CLICK_MACRO_PLACEHOLDER" }}); })();
The New Fundamentals Behind Bitcoin’s Supercycle Thesis
According to the CryptoQuant report, the case for a potential Bitcoin supercycle is built on structural forces that were absent in previous market cycles. The most significant shift comes from institutional adoption. Spot Bitcoin ETFs, led by issuers such as BlackRock, have introduced a persistent and regulated source of demand from traditional finance.
Unlike speculative retail flows, these vehicles treat Bitcoin as a strategic asset allocation, creating steady absorption rather than short-lived hype.
On-chain data further reinforces this narrative. Exchange reserves continue to trend lower, signaling long-term accumulation and reduced sell-side pressure. At the same time, the Spent Output Profit Ratio (SOPR) remains relatively rational. Profit-taking is occurring, but without the euphoric spikes historically associated with cycle tops, suggesting a more mature and disciplined market structure.
var rnd = window.rnd || Math.floor(Math.random()*10e6); var pid607473 = window.pid607473 || rnd; var plc607473 = window.plc607473 || 0; var abkw = window.abkw || ''; var absrc = 'https://servedbyadbutler.com/adserve/;ID=172179;size=0x0;setID=607473;type=js;sw='+screen.width+';sh='+screen.height+';spr='+window.devicePixelRatio+';kw='+abkw+';pid='+pid607473+';place='+(plc607473++)+';rnd='+rnd+';click=CLICK_MACRO_PLACEHOLDER'; document.write('
');
if (!window.AdButler){(function(){var s = document.createElement("script"); s.async = true; s.type = "text/javascript";s.src = 'https://servedbyadbutler.com/app.js';var n = document.getElementsByTagName("script")[0]; n.parentNode.insertBefore(s, n);}());}
var AdButler = AdButler || {}; AdButler.ads = AdButler.ads || []; var abkw = window.abkw || ''; var plc452519 = window.plc452519 || 0; (function(){ var divs = document.querySelectorAll(".plc452519:not([id])"); var div = divs[divs.length-1]; div.id = "placement_452519_"+plc452519; AdButler.ads.push({handler: function(opt){ AdButler.register(172179, 452519, [728,90], 'placement_452519_'+opt.place, opt); }, opt: { place: plc452519++, keywords: abkw, domain: 'servedbyadbutler.com', click:'CLICK_MACRO_PLACEHOLDER' }}); })();
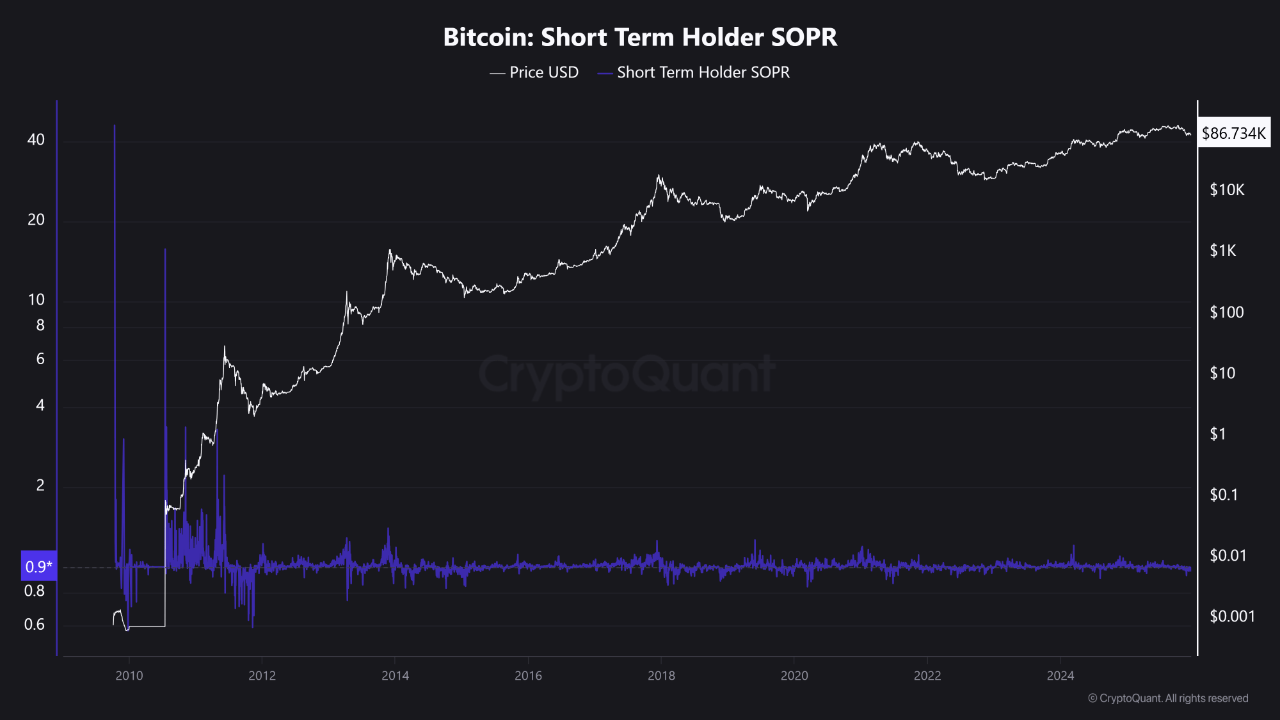 Bitcoin Short-Term Holder SOPR | Source:
CryptoQuant
Bitcoin Short-Term Holder SOPR | Source:
CryptoQuant
Infrastructure readiness is another critical pillar. While Bitcoin remains the core asset, scalability improvements across the broader crypto ecosystem—such as Ethereum’s Fusaka upgrade and the rapid expansion of Layer-2 networks—are enabling faster, cheaper transactions and real-world use cases. This enhances Bitcoin’s role as a settlement and reserve asset within a growing digital economy.
Finally, the macro backdrop remains supportive. Geopolitical instability and the prospect of future monetary easing strengthen Bitcoin’s appeal as a neutral, decentralized hard asset. Together, these forces form a credible foundation for an extended supercycle, though the report cautions that external shocks could still disrupt this trajectory.
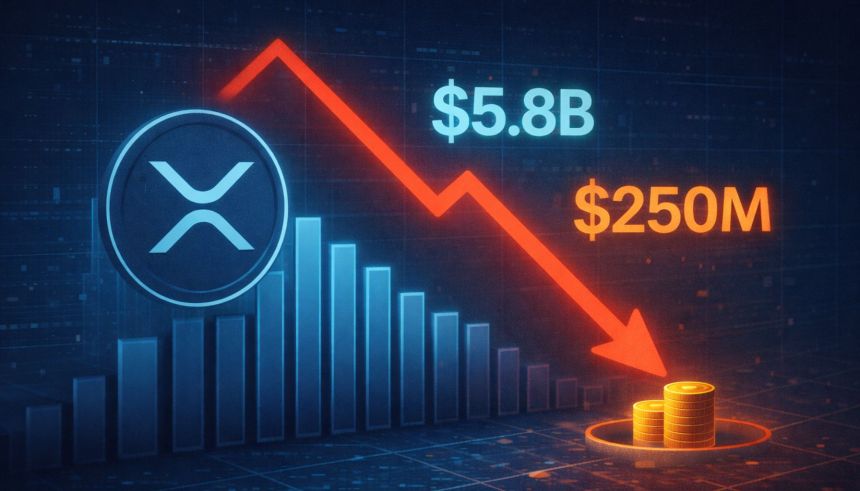
XRP Liquidity Dries Up: Futures Buy Volume On Binance Falls from $5.8B to $250M
Price Action Shows Weak Structure Near Key Support
Bitcoin’s short-term structure remains fragile, as shown on the 4-hour chart. Price continues to trade below the $90,000 psychological level, with repeated failures to reclaim key moving averages reinforcing the bearish bias. The 200-period moving average (red) is clearly sloping downward and acting as dynamic resistance near the $92,000–$93,000 zone, while the 100- and 50-period averages (green and blue) have compressed and rolled over, signaling fading upside momentum.
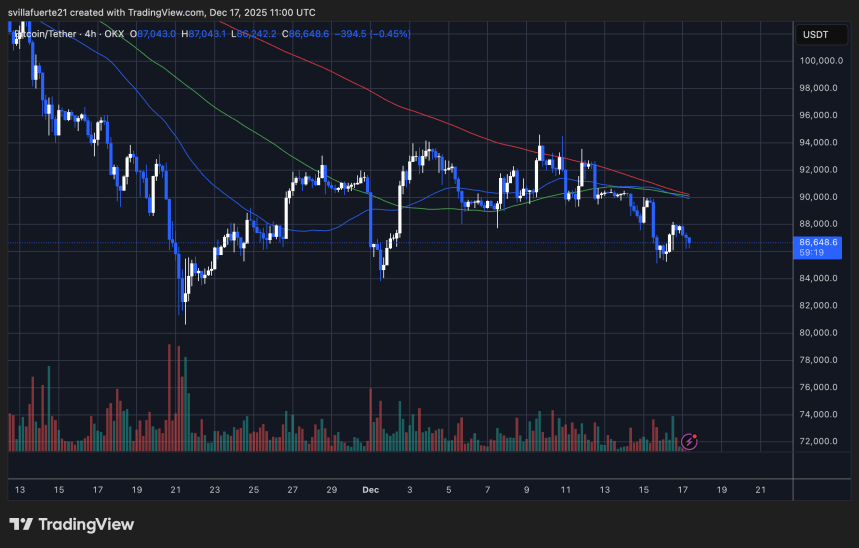 BTC short-term price range | Source:
BTCUSDT chart on TradingView
BTC short-term price range | Source:
BTCUSDT chart on TradingView
After the sharp sell-off earlier in the month, Bitcoin attempted a recovery but stalled below descending resistance. Since then, the price has formed a series of lower highs and lower lows, confirming a short-term downtrend. The current consolidation around $86,000–$87,000 suggests indecision, but notably, bounces are becoming weaker, indicating limited demand on relief rallies.
Market Stress Continues As Bitcoin STH SOPR Dips Below 1– When Will The Pain End?
From a technical perspective, the $85,000–$86,000 area represents a critical support zone. A sustained break below this range would likely open the door to a deeper correction. Conversely, bulls would need a decisive reclaim of $90,000, followed by acceptance above the descending moving averages, to meaningfully shift momentum. Until then, the chart favors consolidation with downside risk.
Featured image from ChatGPT, chart from TradingView.com
0
0
Disclaimer: The content of this article solely reflects the author's opinion and does not represent the platform in any capacity. This article is not intended to serve as a reference for making investment decisions.
You may also like
Crypto, Conflict, and Corruption: Inside Central African Republic’s Digital Gamble
CoinEdition•2025/12/18 12:03
Hive boosts Paraguay Bitcoin mining as rivals pivot to HPC
Crypto.News•2025/12/18 11:57
CFTC Acting Chief Pham Eyes MoonPay Role Post-Selig Confirmation
DeFi Planet•2025/12/18 11:54