Date: Fri, Nov 14, 2025 | 05:45 AM GMT
The cryptocurrency market continues to face heightened volatility as both Bitcoin (BTC) and Ethereum (ETH) witnessed sharp declines of over 4% and 9% respectively, contributing to more than $1 billion in total liquidations over the past 24 hours.
Ethereum has taken a particularly strong hit after dropping to $3,176 from its 24-hour high near $3,561. Yet beneath the ongoing bearish pressure, the chart is signaling something potentially more encouraging — a developing harmonic structure that could hint at a near-term bullish reversal.
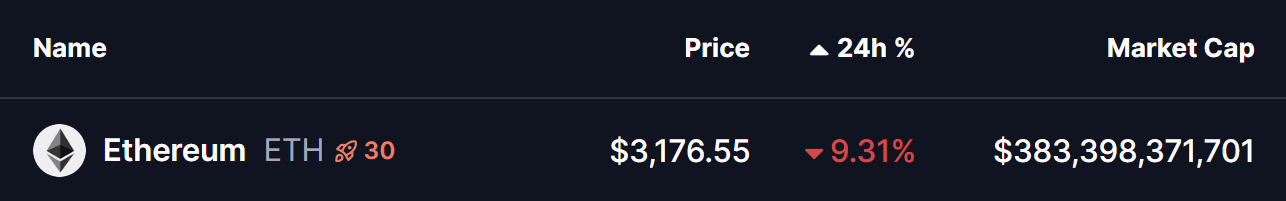 Source: Coinmarketcap
Potential Bullish Harmonic Pattern in Play
On the 4H chart, ETH appears to be forming a Bearish Bat harmonic pattern — a classic structure known for identifying potential reversal zones once its final leg, Point D, is reached.
The pattern began at Point X near $4,253.22, followed by a deep decline into Point A, a relief bounce into Point B, and a renewed correction that recently tapped Point C around $3,107.79. Since hitting this region, ETH has shown signs of stabilization, currently holding around $3,177 as buyers cautiously re-enter the market.
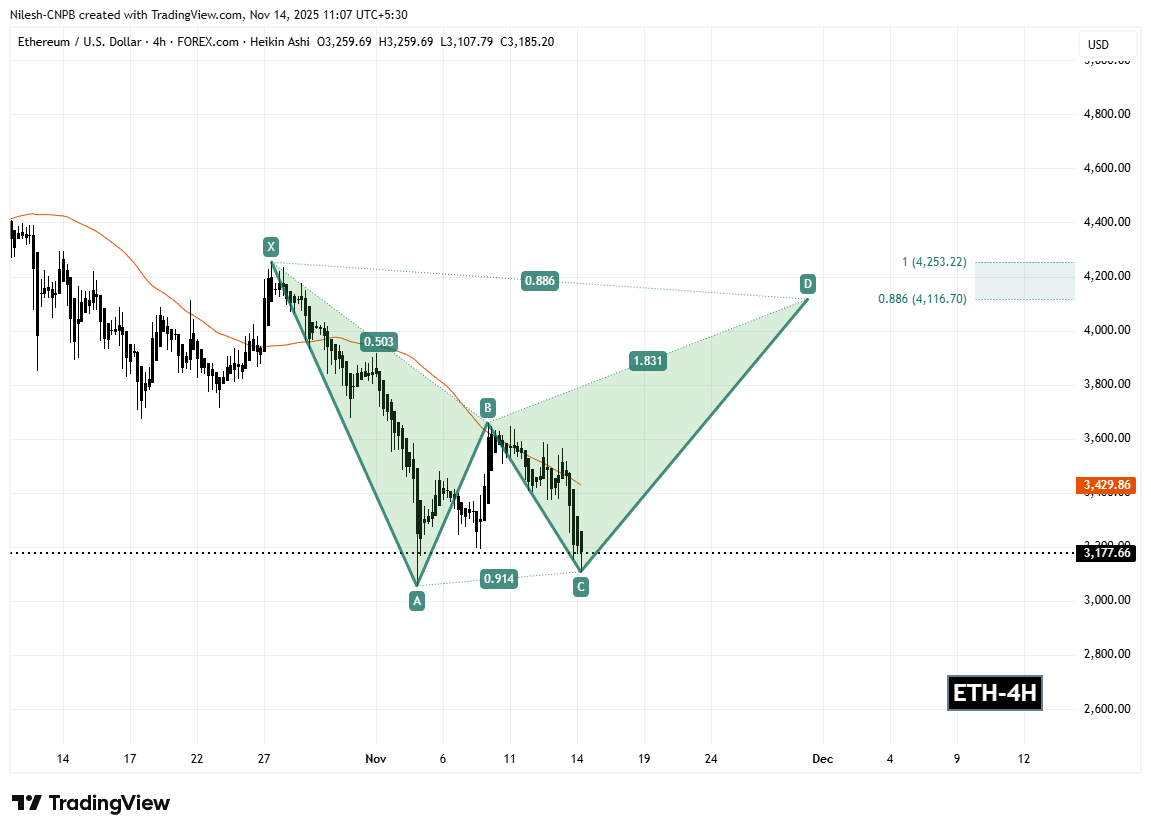 Ethereum (ETH) 4H Chart/Coinsprobe (Source: Tradingview)
Adding strength to the setup, ETH’s 50-period Moving Average (MA), positioned near $3,429, now acts as a key technical resistance. A decisive move and close above this level could signal that Ethereum is shifting from consolidation toward accumulation, validating early signs of a reversal.
What’s Next for ETH?
For this harmonic structure to remain valid, Ethereum must continue holding above the $3,107.79 support at Point C while gradually moving back toward its 50 MA. If bullish momentum builds, the pattern suggests a move toward the Potential Reversal Zone (PRZ) between $4,116 and $4,253 — aligning with the 0.886 to 1.0 Fibonacci retracement levels.
Reaching this zone would signal a potential 34% upside from current levels, indicating that ETH could be preparing for a strong technical bounce if broader market sentiment stabilizes.
However, traders should remain cautious. The harmonic pattern is still under development, and any decisive break below Point C would invalidate the structure, possibly opening the door to deeper corrections before Ethereum can establish a firmer base.