Date: Sat, Oct 18, 2025 | 05:41 AM GMT
The cryptocurrency market continues to show choppy movement, as both Bitcoin (BTC) and Ethereum (ETH) have slipped by over 1.50% over the past 24 hours. This mild correction has rippled across the broader market, with total liquidations surpassing $900 million — of which around $627 million came from long positions.
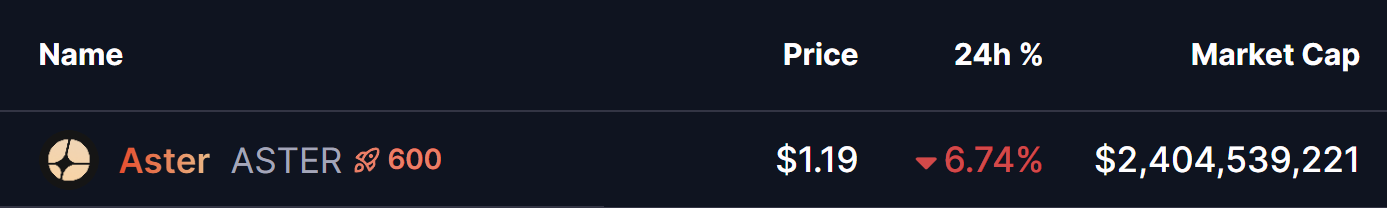
Following the broader trend, Aster (ASTER) has also seen a 6% decline today. However, beneath the surface of this bearish pressure, the chart is hinting at a potential bullish reversal, thanks to the emergence of a harmonic pattern that could signal an upcoming upside move.
 Source: Coinmarketcap
Harmonic Pattern Hints at Potential Upside
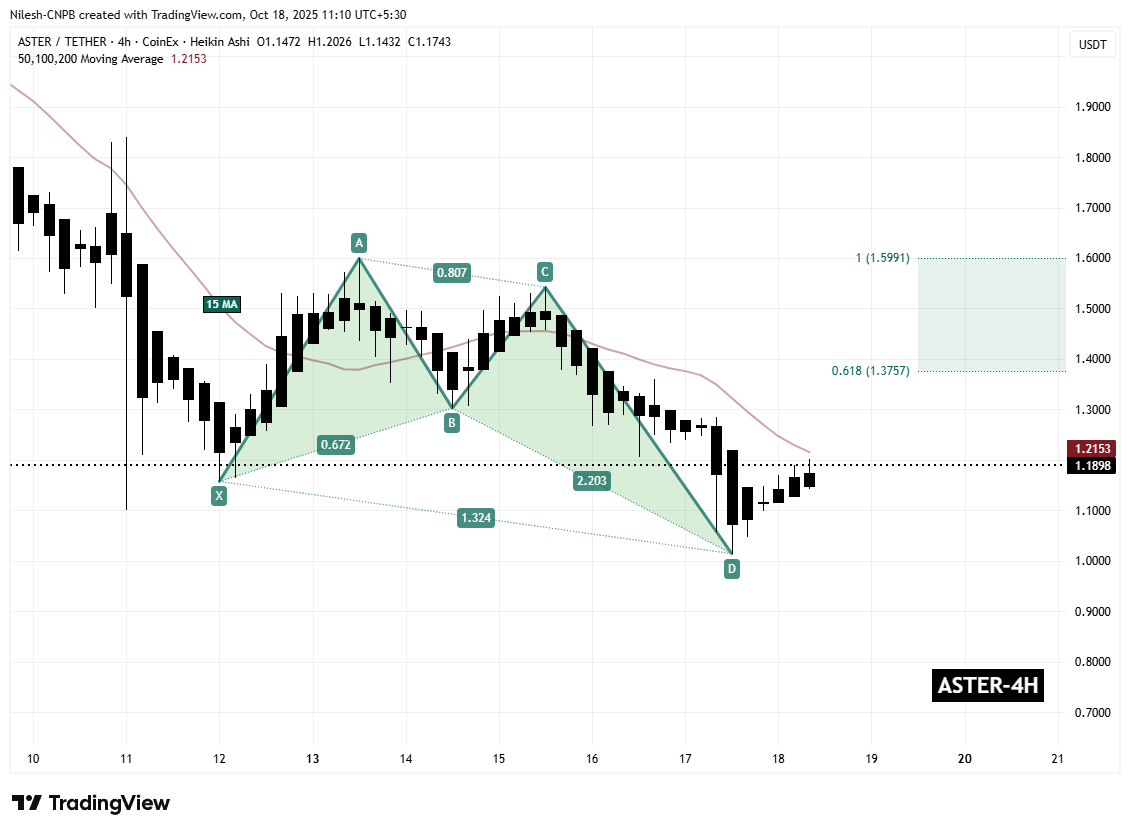
On the 4-hour chart, Aster appears to be completing a Bullish Butterfly harmonic pattern — a formation that often marks the end of a downtrend and the beginning of a fresh upward move.
The pattern started with an initial leg from Point X around $1.1573, followed by a strong rise to Point A, a pullback to Point B, a rebound to Point C, and finally, a decline to Point D near $1.0142 — where the potential reversal zone (PRZ) seems to be forming.
 Aster (ASTER) 4H Chart/Coinsprobe (Source: Tradingview)
Since hitting that level, ASTER has shown early signs of recovery, currently trading around $1.19. What’s worth watching now is the 15-hour moving average (MA), which sits around $1.2153 — a crucial short-term resistance zone that could determine whether ASTER’s rebound gathers momentum or stalls.
What’s Next for ASTER?
If Aster manages to break above the 15-hour MA with increasing buying volume, the Bullish Butterfly pattern projects potential upside targets between $1.3757 (0.618 Fibonacci extension of the CD leg) and $1.5991 (1.0 Fibonacci extension).
These zones often act as the final stage of the Butterfly formation — where traders may take profits or the market may consolidate before deciding its next direction.
However, the bullish scenario remains valid only if ASTER holds above the D-point support near $1.01. A confirmed breakdown below this level would invalidate the harmonic setup and potentially extend the downside before any meaningful recovery takes place